
Assess and Track Employee Performance Levels Without Ratings and Annual Reviews

If you're looking for an organization-wide change to move away from annual reviews and ratings, but still want a way to assess and track performance we can help.
Assess performance accurately, fairly, and equitably—Recognize and minimize assumptions and common bias flashpoints.
We'll show you how to leverage the Employee Performance Continuum visual model to create a richer and more precise understanding of performance effectiveness throughout your organization. You'll experience a common set of tools and shared vocabulary to accurately and consistently assess performance.
Rating-less Performance Management Software
Our web application allows you to assess and track employee performance without ratings.
Our training and tools will help you assess and track performance based on two elements:
Work Results and Observed Behaviors.
Work Results describe what the person's getting done at work according to their job description and responsibilities.
Behaviors represent how well employees are interacting with their manager, their team, and others.

Using our Team Plotting process you'll accurately assess employee performance throughout your organization. The information is plotted visually on a graph, making it easy to see where employees fall on the Continuum and how they're progressing. You'll access your organization's rating-less performance metrics in our web application, an easy-to-navigate cloud-based tool.
Jamie Resker, Founder and Practice Leader of Employee Performance Solutions created the Employee Performance Continuum™ as an alternative to traditional performance review ratings. The model is the starting point that helps inform the right conversations between managers and employees and track ongoing performance progress. See more about our consulting support on how to assess performance without ratings here.
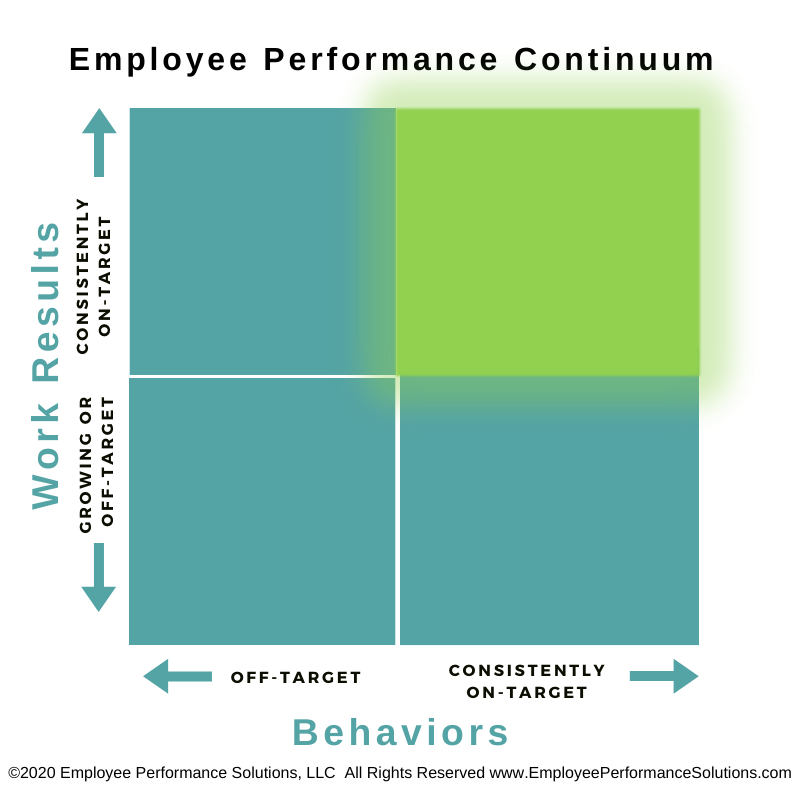
 "Upper Right" On-Target Work Results and Behaviors: Mid to high Work Results and expected value-adding Observable Behaviors (your dream employees!)
 "Lower Right" On-Target Work Results and Behaviors: These are your new hire employees or people who have moved into a new/different or expanded role. People in this category are right where they should be and are making steady and expected progress. Continue supporting their acclimation to the role and responsibilities.
Try this visual tool to visually plot employee performance
Try it! Click Here for the Worksheet
 "Lower Right" On-Target Behaviors, but Off-Target Work Results: This is the employee that's pleasant to work with, but despite making an earnest effort, their Work Results in some or most areas are continually below expectations. Their work is reassigned to more competent staff, or the job is scaled back so much that it's no longer the job the person was hired for. This person may need extra support or a new role, which our method addresses.
 "Upper Left" On-Target Mid to High Work Output, But a Pattern of Off-Target Value-Detracting Behavior: This is the employee whose Work Results are valued but often depletes others' time and energy and creates extra work for the manager. This person may demonstrate behavior that goes against organizational values, sets a poor example for others, or makes people avoid or work-around the individual. Often, this employee's behavior is a poor reflection on themselves and his/her manager, who seemingly allows the action to continue. Our methodology is beneficial in helping managers find the right words to help course-correct off-target behavior.
 "Lower Left Quadrant": Yikes! Did this person retire and forget to tell you? Unfortunately, this is the individual whose behavior detracts from their overall performance contributions and they won't or can't accomplish the work.


.png?width=1500&name=Copy%20of%20Measure%20Performance%20Without%20Ratings%20(1).png)
-1.png?width=150&height=75&name=Copy%20of%20Copy%20of%20Copy%20of%20Untitled%20(2)-1.png "Copy of Copy of Copy of Untitled (2)-1")